This tool helps your working clients better plan their retirement, and gives them a new perspective on how they are achieving their financial goals over time.
To generate this graph -
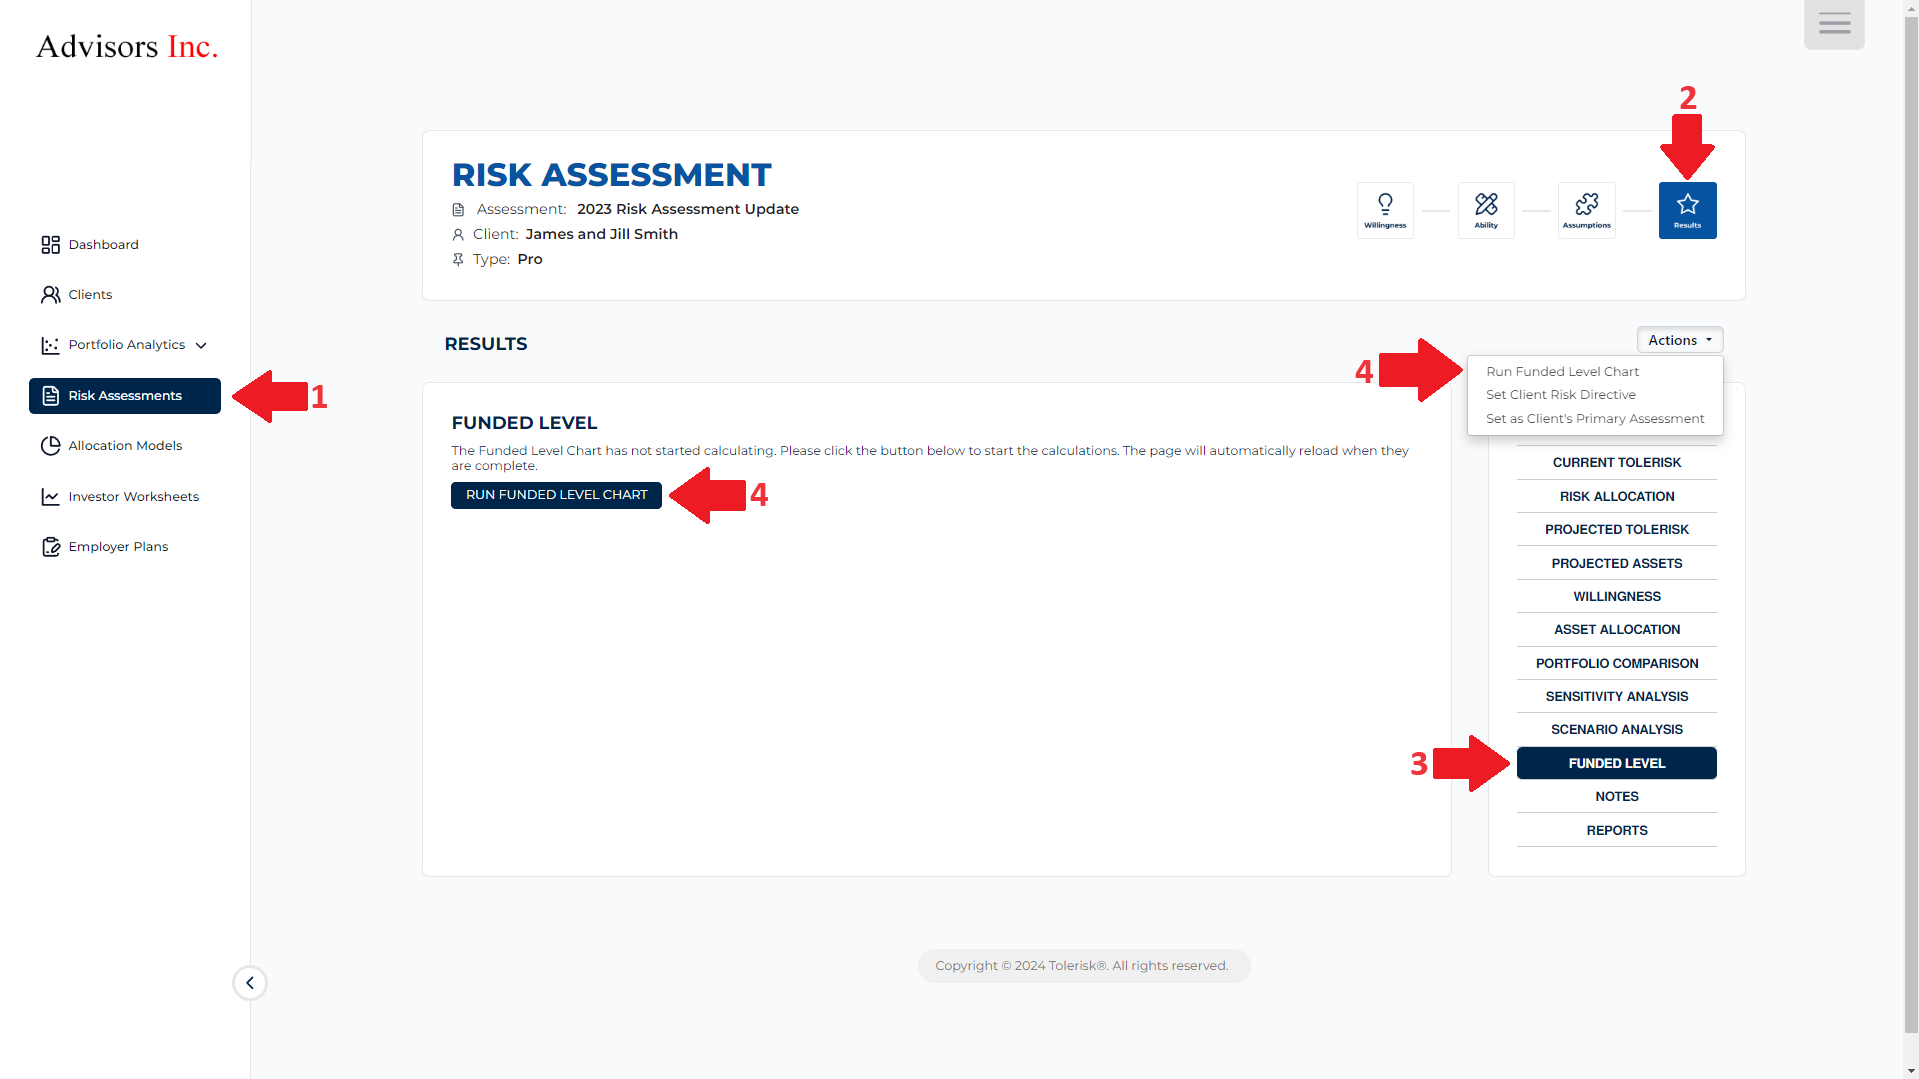
- Go to the results section of the client and assessment that you want to generate the graph for.
- Click the "Funded Level" option located at the right side of the results page.
- Click the "Run Funded Level Chart" button. (You can also run the funded level chart by clicking the Actions dropdown circled in the picture below, and then clicking "Run Funded Level Chart".
- Wait for the chart to generate. This may take a while, as the system has to crunch all the numbers.
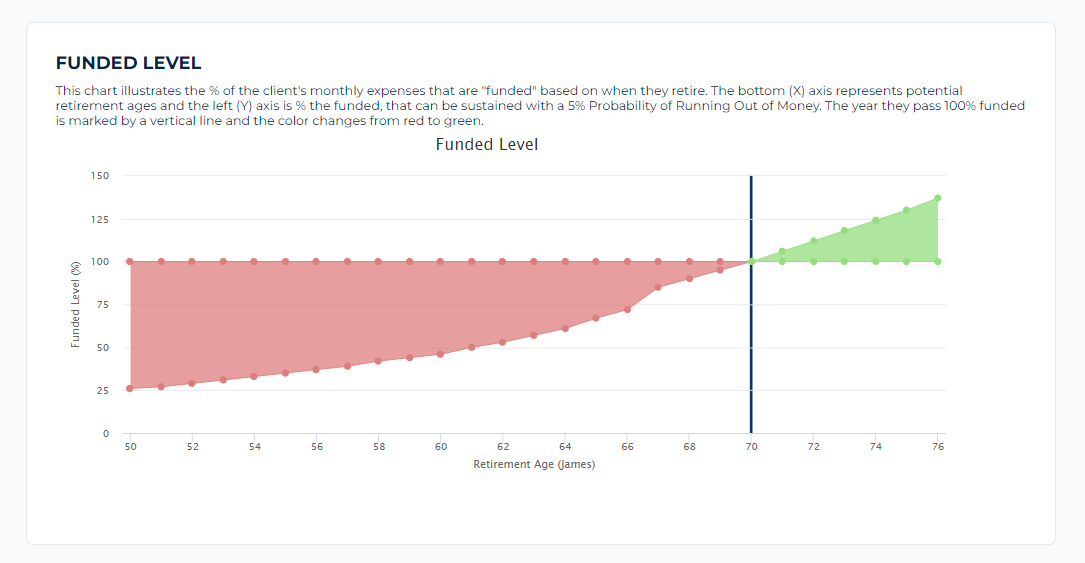
- Your chart is now ready to view!
The video below walks you through an example -