Here is some information about your Clients' Risk Assessment results. Our other articles will cover each section in more detail -
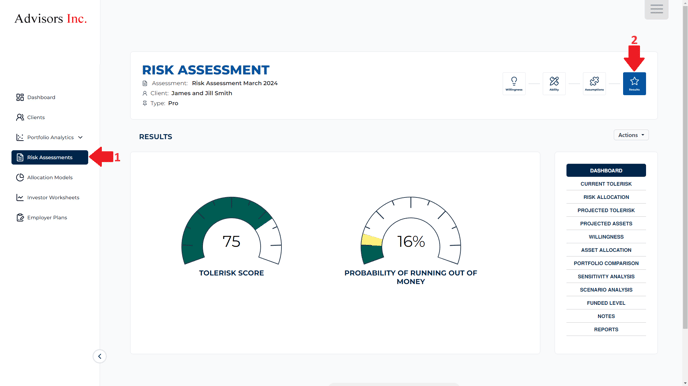
- The Tolerisk Score combines the investor's Ability & Willingness to take investment risk, with the lower of the two acting as the constraint and therefore the Tolerisk Score. It is expressed as the numerator in a simple stocks/bonds ratio. It is based on the single-path cash-flows and all entered financial assumptions.
- The Probability of Running Out of Money is a calculation of this client's cash flows run over 1000+ historical scenarios of Stocks, Bonds, and Inflation, and combined with a Mortality Table to produce a historic probability of the client's money running out before they die.
- The Current Tolerisk report shows the Willingness and Ability Scores, separately. The lower of the two is the constraining factor, and is used as the current Tolerisk Score.
- The Risk Allocation tool allows you to better understand your clients' Tolerisk scores by allowing you to differentiate risk by tax status and visualize how their risk level can be spread across their accounts.
- The Projected Tolerisk®chart will show estimated Tolerisk®Scores as the client ages. This assumes that all future cash flows transpire as entered. You will see that the lower of the Willingness and Ability Scores are used as the Tolerisk Score.
- Hovering your mouse over each bar will show the Tolerisk®Score in that year.
- The Projected Assets chart graphs the client's asset value into the future using the assumptions in the model. The Growth Rate is dynamic, meaning that it changes in the future as though the client were to follow the Projected Tolerisk path.
- Hovering your mouse over each bar will show the value of the assets in that year.
- The Willingness section on the Results page of each of your client's risk assessments gives you a breakdown of their answers to the first component of the two-dimensional risk assessment.
- The Asset allocation page in the results section will display the recommended allocation corresponding to your client's Tolerisk score, based on models you create on the "Allocation Models" page.
- The Portfolio Comparison tab in the results section of your client's risk assessments allows you to compare your client’s current accounts/ your recommendations against their risk assessment result.
- The Sensitivity Analysis report shocks each input and shows how it would affect the Tolerisk®Score and the age when the client's money would run out. A red bar represents a decrease in the Tolerisk®Score, or an Increase in the Probability of Running Out of Money.
- The Scenario Analysis page uses your client's specific cash-flow and time horizon, irrespective of their personality score, and layers them over historical data dating - back to the 1920s. In other words, Tolerisk®runs your client's cash-flows assuming a historical starting point EACH and EVERY month since 1926. This allows us to see how well their finances held up in a very wide range of historical stock, bond, and inflation cycles. There are two tables that show the results in different ways. In both cases, the column on the left hand side depicts sample equity and treasury portfolios. Viewing the table by Age shows the probability of the client's money lasting until specific ages based on the historical analysis. Viewing the table by Percentile shows the age at which the client's money runs out with various probabilities. The first column titled Worst (for 100th percentile, being the single worst scenario) shows the worst case of all scenarios. As we look at the columns further to the right, we see the 99th percentile scenario and the 95th percentile, etc. The table doesn't display ages beyond 120. The Historical Benchmark Returns table shows returns, volatility, and maximum drawdowns for combinations of the stock and bond indexes used in the Scenario Analysis table. Drawdowns can be shown as period returns or annualized returns.
-
Tolerisk's Funded level graph shows your clients what percentage of their future expenses are funded at different points in time. This tool helps your working clients better plan their retirement, and gives them a new perspective on how they are achieving their financial goals over time.
- In addition to the results generated by Tolerisk, you can add personalized notes about your client's profile or risk assessment. You can do so by navigating to the Notes section of the results page.
- You can generate PDF reports for your clients with the data from their assessments. To save some time, you can create custom report templates specifying which report sections you want to include in the PDF.